Multi-Cluster Tracing with Traefik, OpenTelemetry, and Datadog
A single request that crosses three clusters needs to look like a single request when you investigate it. Otherwise you're reading three disconnected log files and guessing at the join.
This post walks through the setup: Traefik Hub in a multi-cluster topology, OpenTelemetry as the wire format, Datadog as the observability platform, and Bits as the AI investigator on top.
The architecture
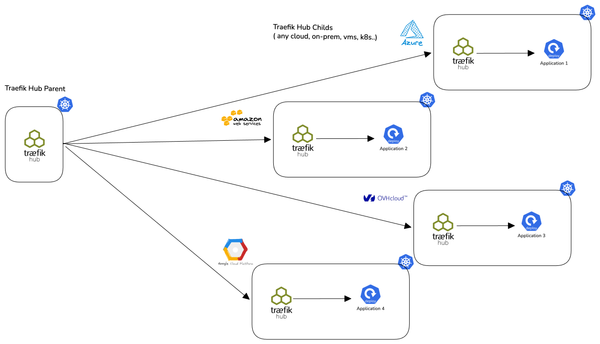
The topology is a Traefik Hub parent fronting a Traefik Hub child across a multiclusters. In this example there is one parent cluster and one child cluster that could be many.:
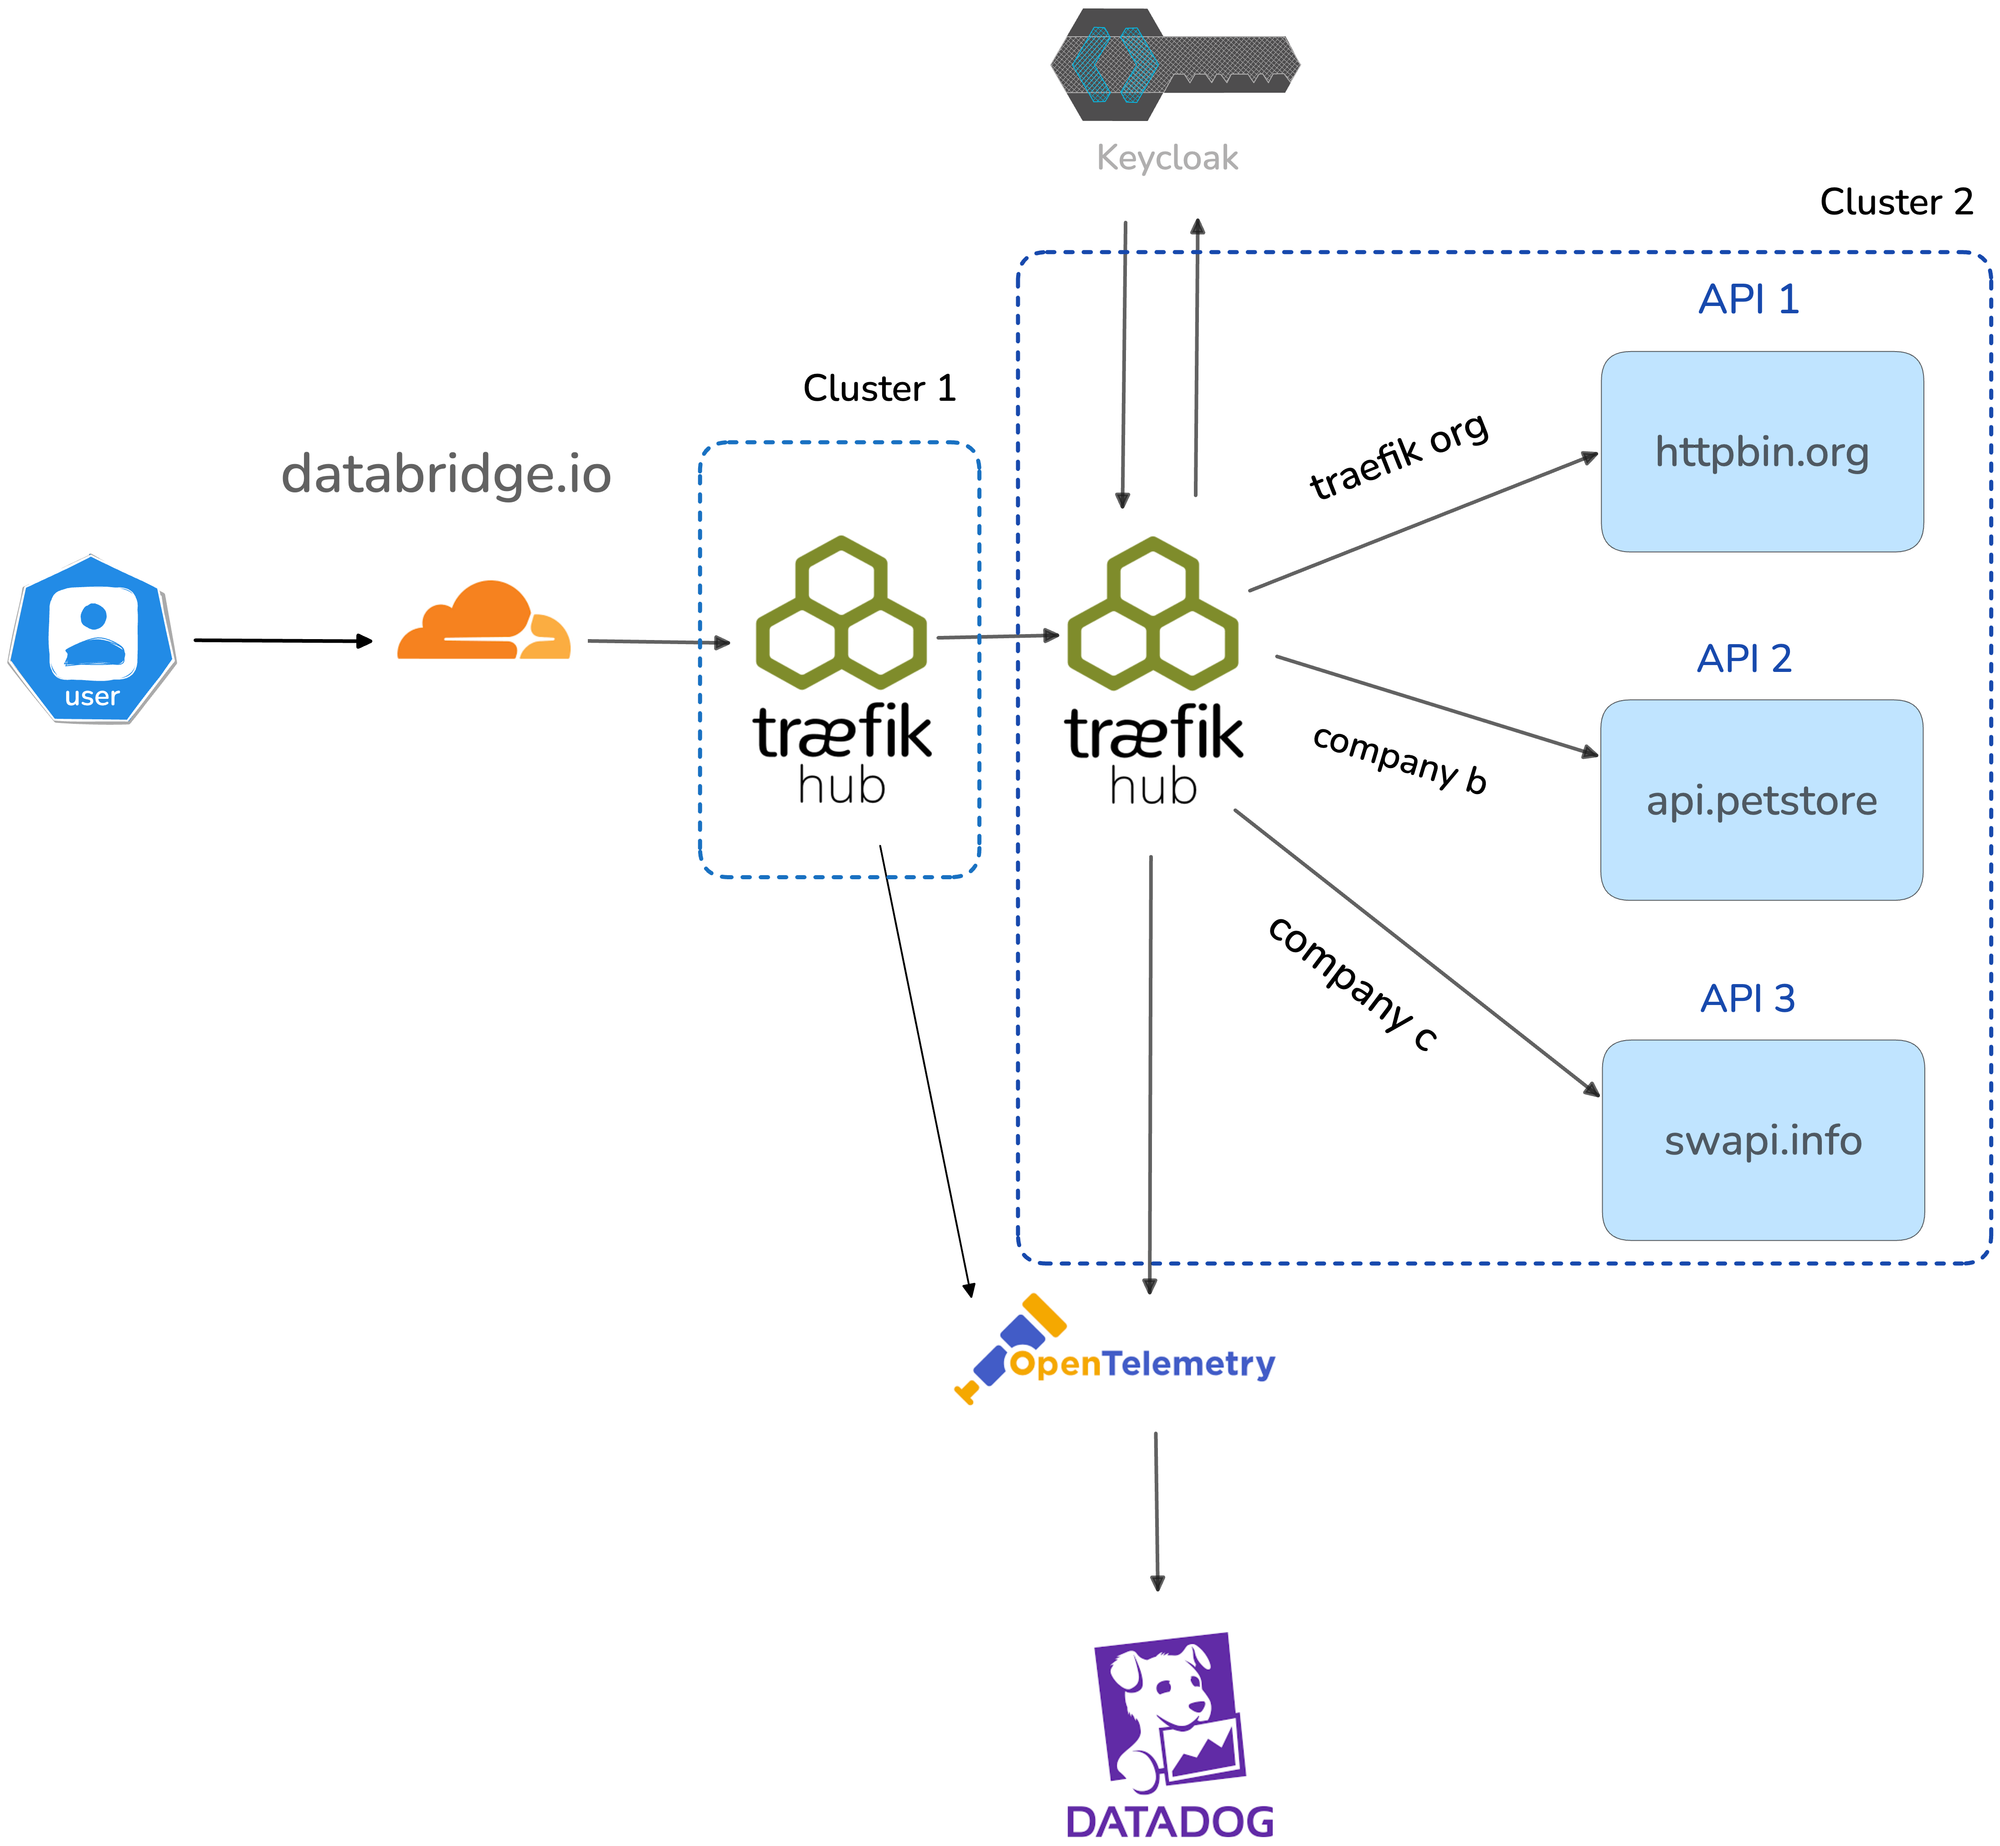
The parent owns ingress and policy. The child owns the IngressRoute CRDs and routes to the workloads. A request from a client traverses parent → uplink → child → upstream, which means a single user request generates spans in two Traefik instances and at least one upstream HTTP call.
Without trace propagation, that's three views of the same request. With trace propagation, it's one trace.
OpenTelemetry as the wire format
Traefik speaks OpenTelemetry natively for traces, metrics, and logs. You configure each signal in the Helm values for your Traefik Hub deployment. Here's the parent configuration:
# OTLP Tracing Configuration
tracing:
  otlp:
    enabled: true
    http:
      enabled: true
      endpoint: http://datadog-agent.datadog.svc.cluster.local:4318/v1/traces
  serviceName: traefik-hub-parent
  resourceAttributes:
    env: dev
    service: traefik-hub-parent
    deployment.environment: dev
  addInternals: true
  sampleRate: 1.0

# OTLP Metrics Configuration
metrics:
  otlp:
    enabled: true
    http:
      enabled: true
      endpoint: http://datadog-agent.datadog.svc.cluster.local:4318/v1/metrics
    addEntryPointsLabels: true
    addRoutersLabels: true
    addServicesLabels: true
    serviceName: traefik-hub-parent

# Access logs with OTLP export
logs:
  access:
    enabled: true
    format: json
    addInternals: true
    fields:
      general:
        defaultmode: keep
      headers:
        defaultmode: keep

# OTLP Logs
additionalArguments:
  - --experimental.otlpLogs=true
  - --accesslog.otlp.http=true
  - --accesslog.otlp.http.endpoint=http://datadog-agent.datadog.svc.cluster.local:4318/v1/logs
  - --log.otlp.http=true
  - --log.otlp.http.endpoint=http://datadog-agent.datadog.svc.cluster.local:4318/v1/logs
The child cluster uses the same pattern with serviceName: traefik-hub-child. Both instances point at the local Datadog Agent's OTLP HTTP port (4318). Trace context propagates over the uplink because Traefik forwards traceparent and tracestate headers by default. The child picks up the context, opens a child span, and the trace stays intact across the cluster boundary.
Access logs go directly to the Datadog Agent over OTLP HTTP, not via container log collection. This gives you trace ID correlation out of the box without relying on log parsing.
Because everything is OTLP, the resource attributes are predictable: service.name, env, deployment.environment, plus the Kubernetes labels the agent injects. Those attributes are what Datadog uses to build the service map, and they're what Bits later uses to correlate logs with spans.
Datadog ingests OTLP
The Datadog Agent has native OTLP ingestion. We deploy it using the Datadog Operator with a DatadogAgent CRD:
apiVersion: datadoghq.com/v2alpha1
kind: DatadogAgent
metadata:
  name: datadog
  namespace: datadog
spec:
  global:
    clusterName: traefik-child-1
    site: datadoghq.com
    credentials:
      apiSecret:
        secretName: datadog-secret
        keyName: api-key
    tags:
      - "env:dev"
      - "team:traefik"

  features:
    otlp:
      receiver:
        protocols:
          http:
            enabled: true    # listens on 0.0.0.0:4318
          grpc:
            enabled: true    # listens on 0.0.0.0:4317
    apm:
      enabled: true
    logCollection:
      enabled: true
      containerCollectAll: true

  override:
    nodeAgent:
      containers:
        agent:
          env:
            # OTLP logs ingestion (off by default)
            - name: DD_OTLP_CONFIG_LOGS_ENABLED
              value: "true"
            # Resource attributes → Datadog tags
            - name: DD_OTLP_CONFIG_METRICS_RESOURCE_ATTRIBUTES_AS_TAGS
              value: "true"
            - name: DD_OTLP_CONFIG_TRACES_RESOURCE_ATTRIBUTES_AS_TAGS
              value: "true"
Three things to know about that config. First, traces and metrics ingestion is on by default once the OTLP receiver is enabled in features.otlp. Second, OTLP logs are off by default to avoid surprise billing. You opt in explicitly by setting DD_OTLP_CONFIG_LOGS_ENABLED=true as an environment variable. Third, the resource attribute environment variables ensure that OTel attributes like service.name and deployment.environment become first-class Datadog tags.
Traefik emits OTLP, the agent receives OTLP, and Datadog maps the OTel semantic conventions onto its own service/resource/span model on the way in.
What Datadog does with the data
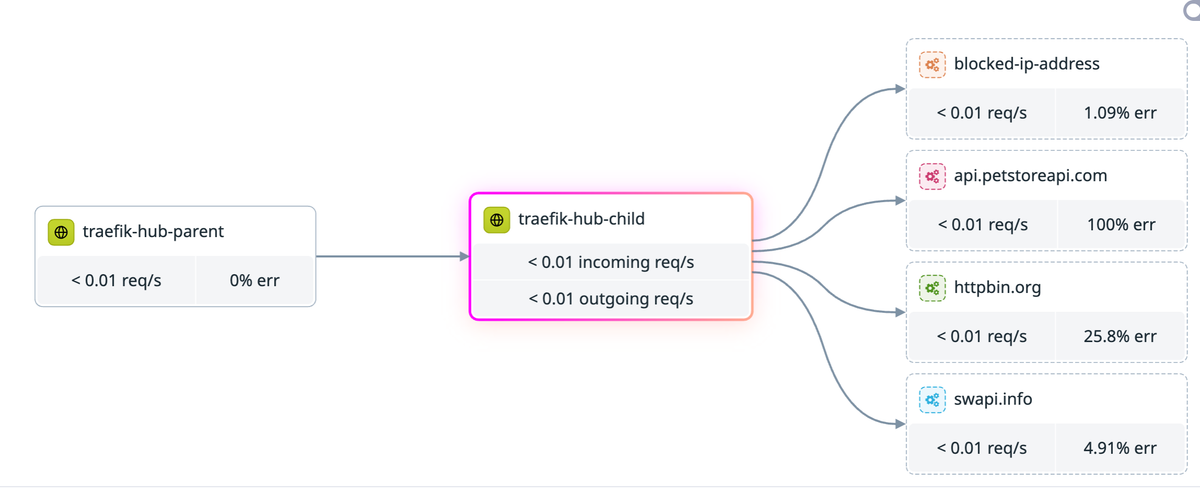
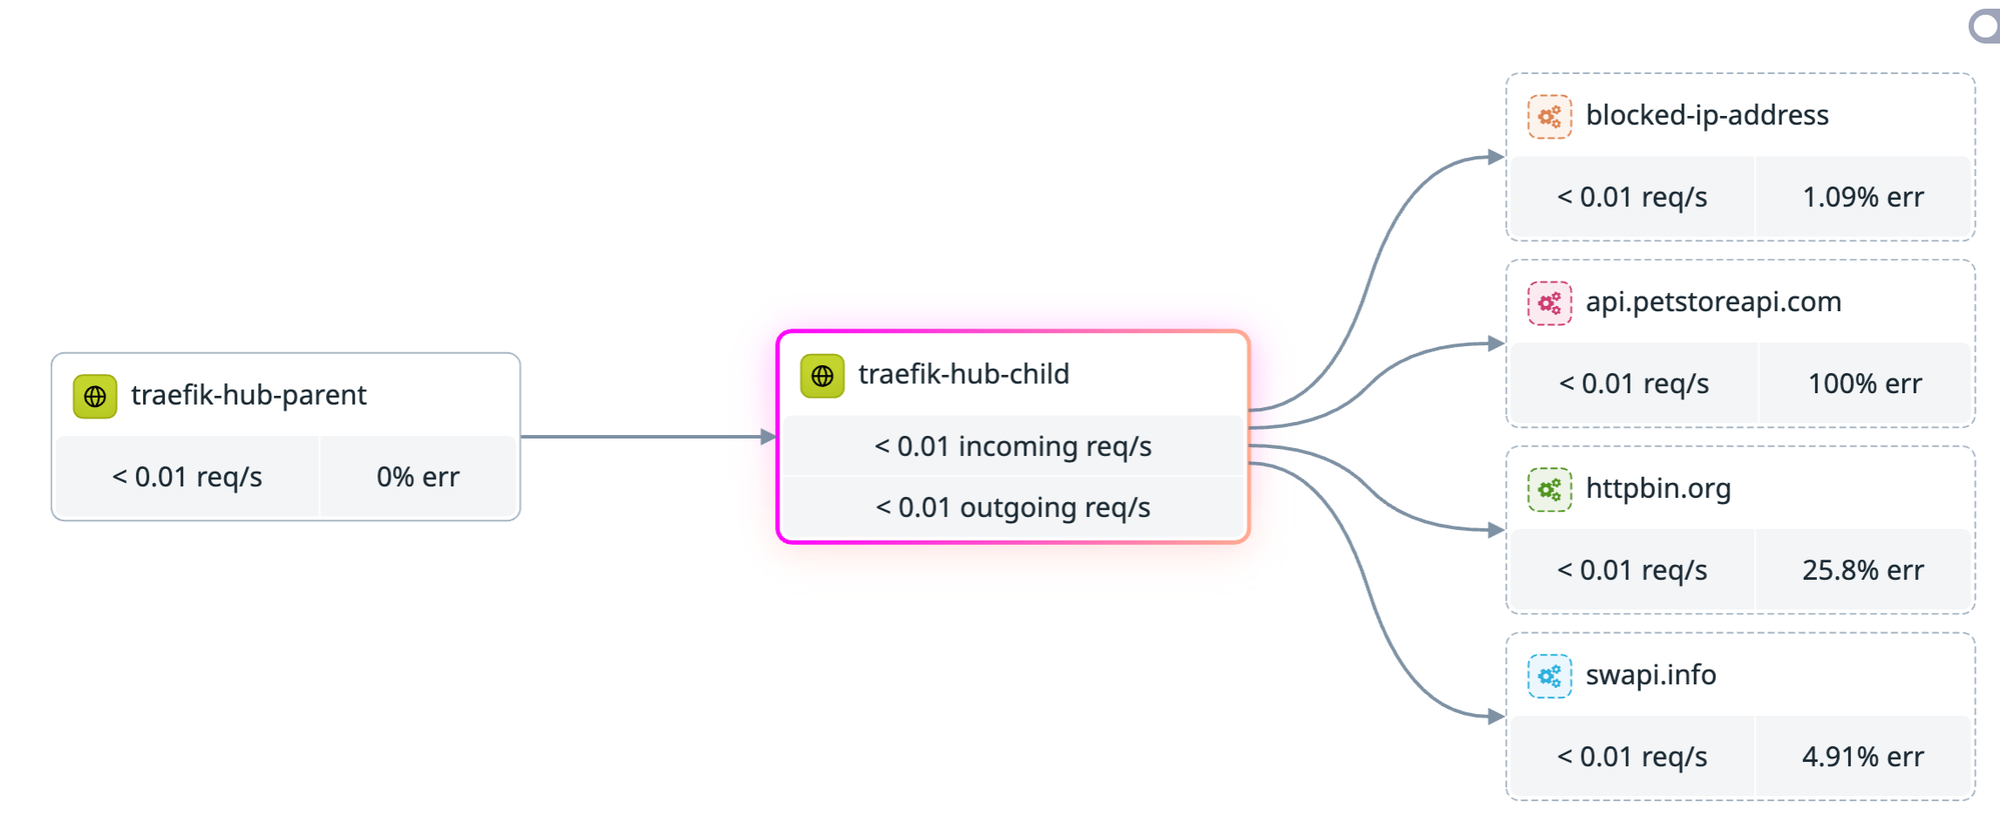
This is where the multi-cluster setup pays off. Datadog joins the spans across clusters by trace ID and renders the actual call graph:
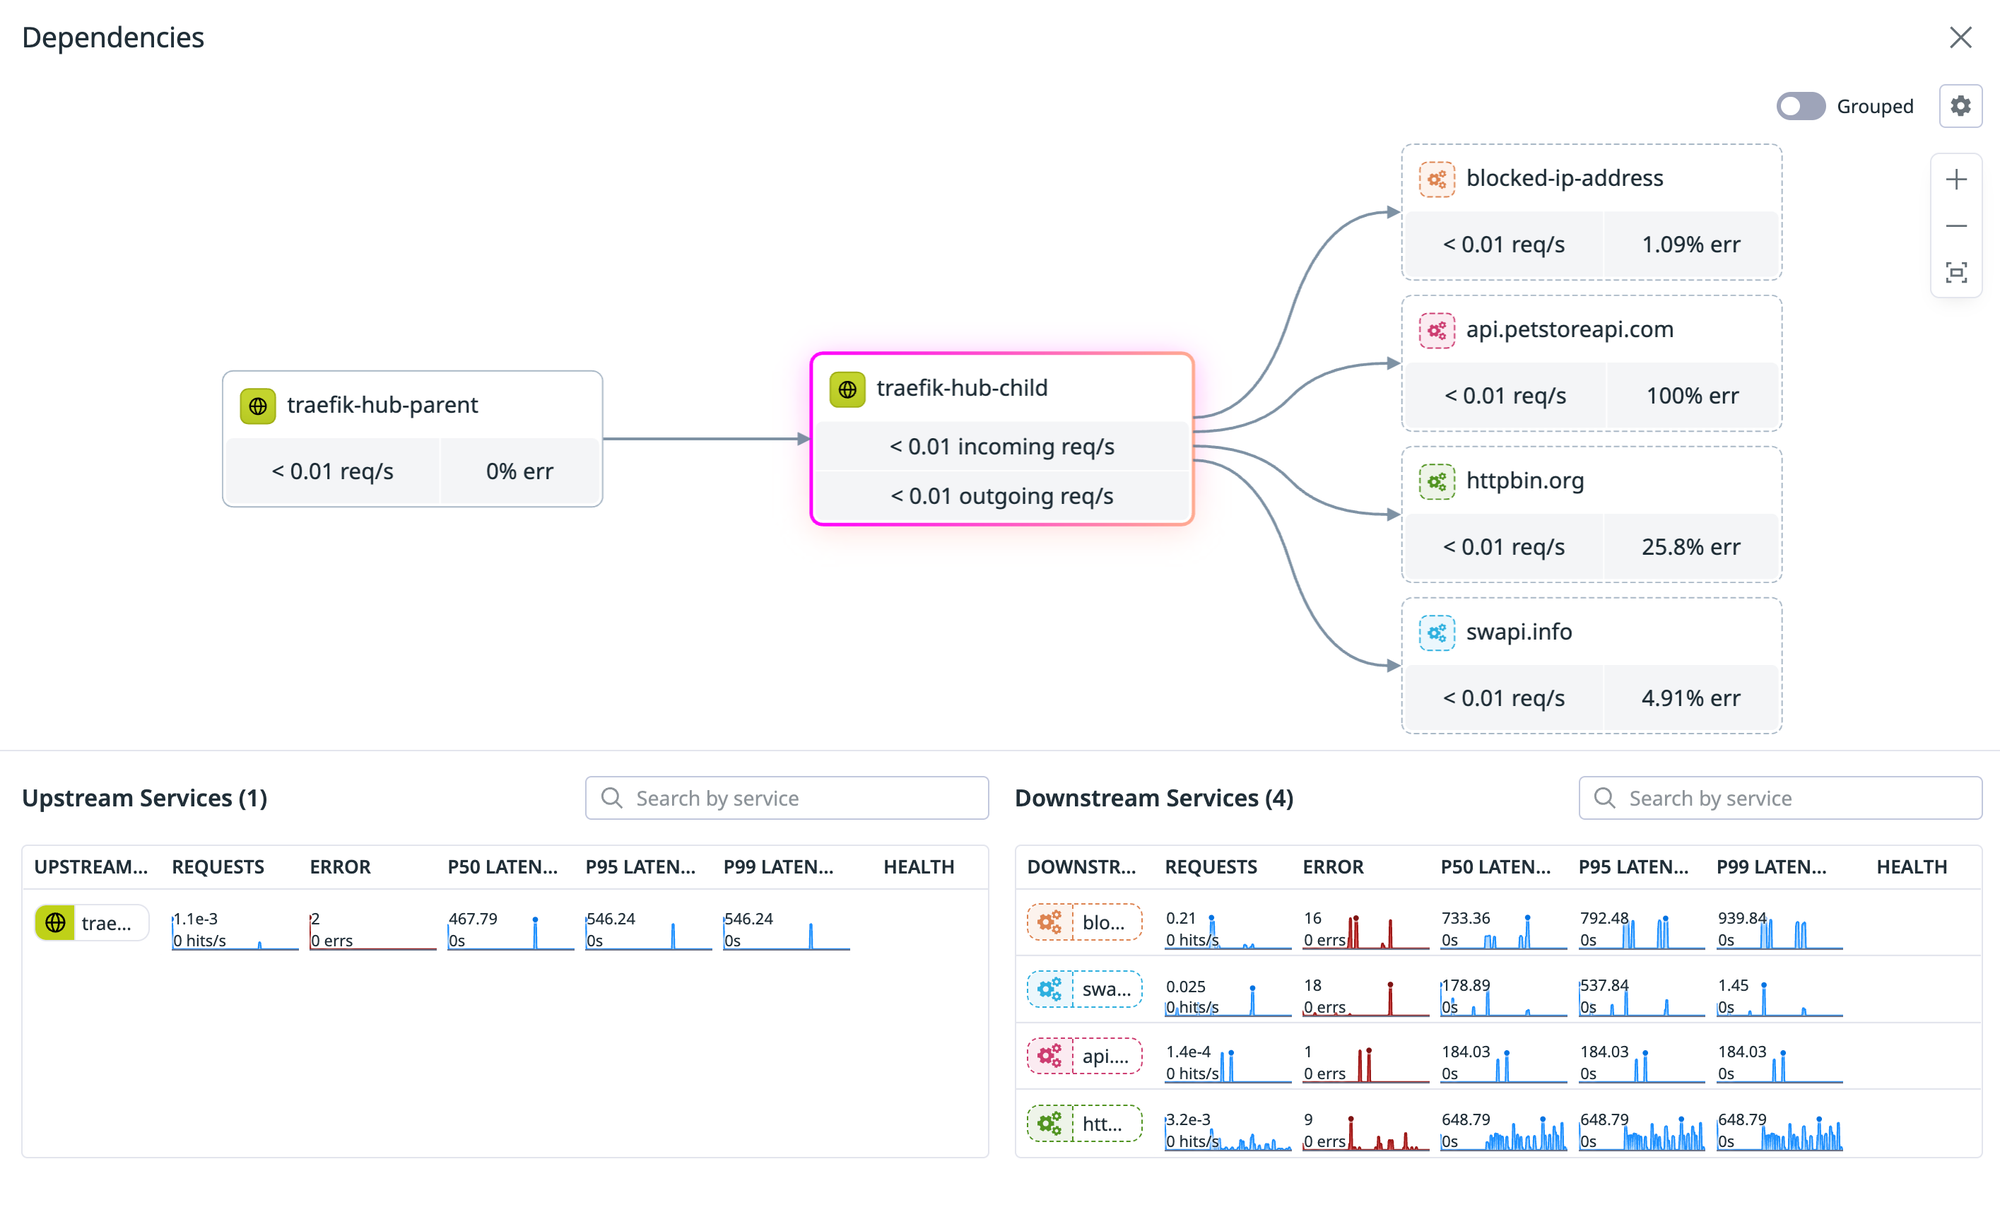
The view above shows traefik-hub-parent, traefik-hub-child as the routing hop, and the downstream errors landing on the external dependencies. Per-edge request rates and error percentages come from the spans. P50/P95/P99 latencies come from the same data, broken out per upstream service in the panel below the graph.
Three signals end up correlated by trace ID and resource attributes:
- Traces and spans give per-hop latency and the call structure.
- Metrics give the rate and error trends over time.
- Logs are joined by trace ID and pod identifiers, so you jump from a slow span directly into the log lines for that exact request.
That join is what makes the data investigable instead of just stored.
Bits surfaces two real issues
I ran a general investigation in Bits, Datadog's AI investigator, against a window with elevated noise on the child. Five minutes later, two findings.
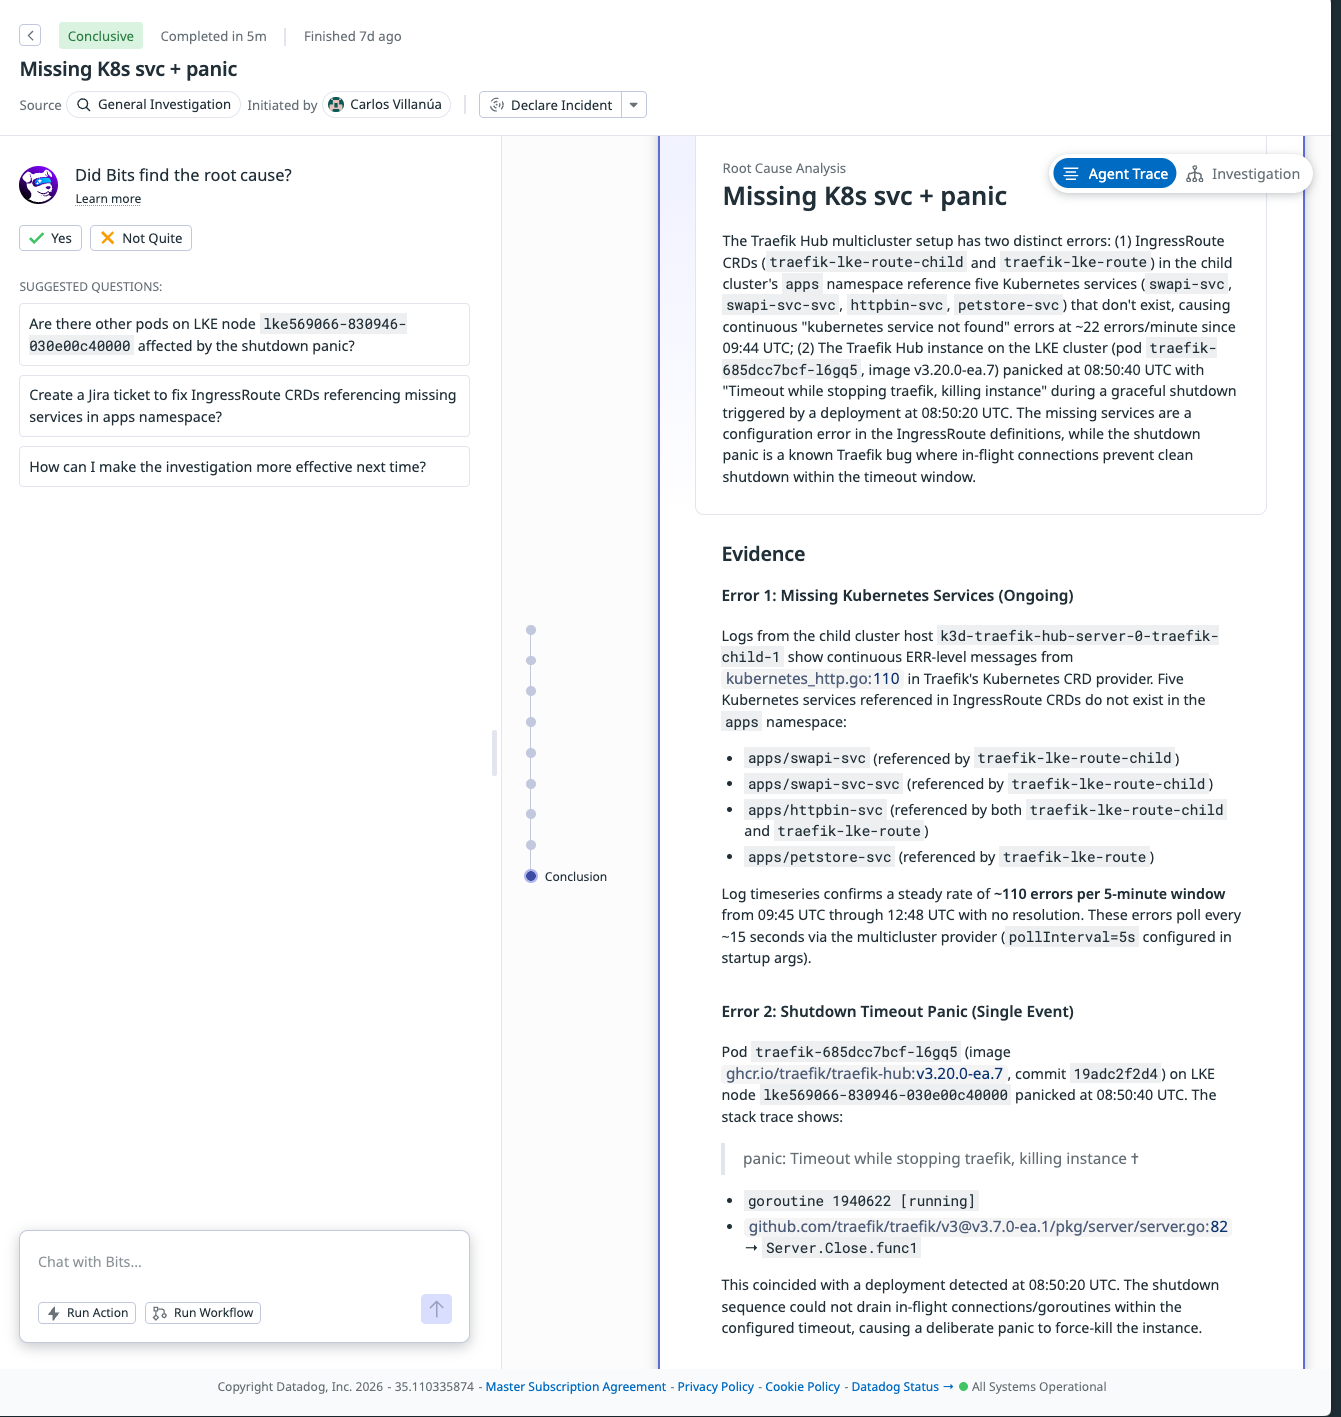
Finding 1: missing Kubernetes services
The Traefik Kubernetes provider on the child cluster was logging continuous ERR-level messages from kubernetes_http.go:110. Five Kubernetes services referenced in IngressRoute CRDs do not exist in the apps namespace:
apps/swapi-svc(referenced bytraefik-lke-route-child)apps/swapi-svc-svc(referenced bytraefik-lke-route-child)apps/httpbin-svc(referenced by bothtraefik-lke-route-childandtraefik-lke-route)apps/petstore-svc(referenced bytraefik-lke-route)
The provider polls every 5 seconds (pollInterval=5s per the startup args), which produces a steady ~110 errors per 5-minute window. Bits read the logs, correlated them to the CRD definitions, and named the exact routes that needed fixing.
Finding 2: shutdown-timeout panic
Pod traefik-685dcc7bcf-l6gq5 (image ghcr.io/traefik/traefik-hub:v3.20.0-ea.7, commit 19adc2f2d4) panicked at 08:50:40 UTC with:
panic: Timeout while stopping traefik, killing instance
goroutine 1940622 [running]
github.com/traefik/traefik/v3@v3.7.0-ea.1/pkg/server/server.go:82
  → Server.Close.func1
Bits lined this up with a deployment event detected at 08:50:20 UTC. The shutdown sequence could not drain in-flight goroutines within the configured grace period, so the runtime force-killed the instance. Bits also analyzed the HTTP 499 errors on traefik-hub-parent and concluded they were client cancellations from a bruno-runtime/3.2.2 test client, not server-side failures.
What's actually doing the work
Four layers, each earning its place:
- OpenTelemetry gives a vendor-neutral wire format and predictable semantic conventions.
- Traefik Hub propagates trace context across the multicluster uplink so spans from parent and child belong to the same trace.
- The Datadog Agent ingests OTLP natively, so the pipeline is configuration, not code.
- Datadog and Bits join traces, spans, metrics, and logs by trace ID and resource attributes, then run AI investigations on top of the joined data.
Take any one of those out and the value drops sharply. Run all four and a multi-cluster trace becomes a single artifact you can investigate.
And you?
How are you propagating trace context across cluster boundaries today? If you're running a parent/child gateway pattern or any kind of multi-cluster ingress, what does your OTel pipeline look like?